Small and medium-sized enterprises (SMEs) face tremendous competition while dealing with unexpected challenges. They have a wealth of data at their disposal, but struggle to transform it into actionable insights. In such a complex scenario, they must make decisions based on either intuition or incomplete information. Here, SAP B1 dashboards come to their rescue.
As a robust and integrated ERP solution, SAP B1 can unify all critical business functions. Apart from this, SMEs can track various KPIs (Key Performance Indicators) through SAP B1 KPI dashboards. These dashboards show real-time insights in a visually rich way. In this post, we will dig deep into the ERP KPI tracking and the role of SAP Business One in it.
Let’s start by discussing the importance of KPIs for SMEs.
Importance of KPIs for SMEs
Key Performance Indicators or KPIs play a vital role in providing SMEs with objective measures of overall functionality. They offer a detailed, clear, and quantifiable snapshot of the health of any business. As a result, SMEs can go beyond anecdotal evidence and subjective assessments for making decisions.
Whether your SME wants to track sales conversion rates or inventory turnover, KPIs give all the essential numbers to measure success and identify areas for improvement. Moreover, KPIs can act as an early warning system for any business, irrespective of its size and industry sector.
When your team members are on the same page and monitoring the same KPIs, you can foster goal alignment. Simply put, a KPI-driven approach gives a significant edge over competitors over the period. SMEs can thrive and sustain their business models by tracking KPIs regularly.
Let’s make a list of key KPIs that SMEs can track using SAP B1 dashboards.
Essential KPIs You Can Track Using SAP B1 Dashboards
The SAP B1 KPI dashboard is highly useful for SMEs as it enables them to harness the advantage of business data by monitoring the right KPIs. SAP Business One has an integrated Analytics Cloud dashboard to display these metrics in real time. Here are the top ERP KPI tracking using SAP Business One-
1. Sales Revenue
This metric represents the total income generated from primary business activities like the sale of goods or services before deducting any expenses. Sales revenue is the top-line figure, excluding expenses, and indicates the value of commercial transactions.
This KPI is useful for assessing overall business performance, and we can consider it as the first indicator of market acceptance for your products or services. You can get predictions for future sales and plan inventory while setting realistic growth targets with the help of this KPI.
The SAP Business One KPI dashboard can showcase total revenue over different periods and as per various parameters like product, customer, and sales channels. SAP B1 dashboards can display current revenue against targets and showcase Y-o-Y growth accurately.
2. Gross Profit Margin
This is one of the most crucial SAP Business One KPIs. It is a profitability ratio that calculates the percentage of revenue left after deducting the COGS (Cost of Goods Sold). COGS includes the direct costs related to the production of the goods that your company has sold, including raw materials and direct labor.
This KPI is useful in evaluating pricing strategies and cost management effectiveness. A healthy gross profit margin indicates proper pricing of products in line with their production costs. A declining margin is an indicator of issues like rising raw materials costs and inefficient production.
SAP B1 dashboards offer stunning visualizations for gross profit margin. Dashboards can highlight items with unusually high or low margins accurately, and SMEs can make informed decisions on that basis. This KPI is beneficial for handling supplier negotiations and optimizing profitability.
3. Inventory Turnover
It is a financial ratio between the cost of goods sold and the average inventory. It shows how many times a company has sold or replaced its inventory in a given period. This KPI shows inventory efficiency. For example, a high inventory turnover indicates efficient sales and inventory management.
On the other hand, a low inventory turnover suggests weak sales and excess inventory that leads to an overstocking condition. SAP Business One Analytics can show this metric to avoid overstocking or a shortage of any product, and making a real-time decision related to purchase or sales.
SAP B1 has a robust inventory management feature that feeds into intuitive dashboards directly. These dashboards can showcase the inventory turnover rate and break it down by the location of the warehouses. It can indicate the slow-moving inventory quickly and accurately.
4. Customer Acquisition Cost (CAC)
CAC is the total cost associated with convincing a potential customer to buy a specific product or service. It includes all marketing and sales expenses, including advertising, salaries of sales and marketing teams, and related costs.
Companies can get the ratio by dividing this figure by the number of new customers acquired over a particular period.
Customer acquisition cost is significant for analyzing the ROI of the company’s sales and marketing efforts. A high CAC relative to the customer lifetime value (CLTV) indicates issues in acquisition strategies and inefficiencies.
You can optimize marketing spend and identify areas of improvement by understanding the CAC number. Sales and CRM modules of SAP Business One give the core data points necessary to measure CAC.
5. Accounts Receivable Aging
It is a report that categorizes outstanding invoices as per the length of time they have been overdue. It shows current invoices, 1-30 days overdue, 61-90 days overdue, and the like. It is one of the critical SAP Business One KPIs for managing cash flow effectively.
A large chunk of aged receivables might indicate issues with credit policies, billing process, and even collection efforts. Regular tracking of accounts receivable aging can help SMEs identify potential bad debts early. You can take proactive steps to collect payments after tracking this KPI.
SAP B1 has finance and sales modules to track accounts receivable and payable. SAP B1 dashboards can give a clear overview of your AR aging buckets in real time. These dashboards usually include drill-down capabilities to view individual overdue invoices.
6. Operating Cash Flow
Operating cash flow represents the amount of cash a company generates from its regular business operations. Investment and financing activities are not involved in these operations. You can adjust it for non-cash expenses and changes in working capital.
OCF can show the company’s financial health and sustainability. Positive and consistent cash flow indicates that your business is generating enough cash from its core activities to cover its expenses. Negative OCF, however, shows underlying operational problems.
SAP Business One has dedicated finance dashboards to show the underlying data. Companies can track cash inflows from sales and outflows for operating expenses. Decision-makers can gain a clear picture of the company’s operational cash by analysing financial metrics.
SMEs can utilize SAP Business One analytics to get all these KPIs. It is advisable to consult a reputed SAP B1 dashboards provider to gain its benefits.
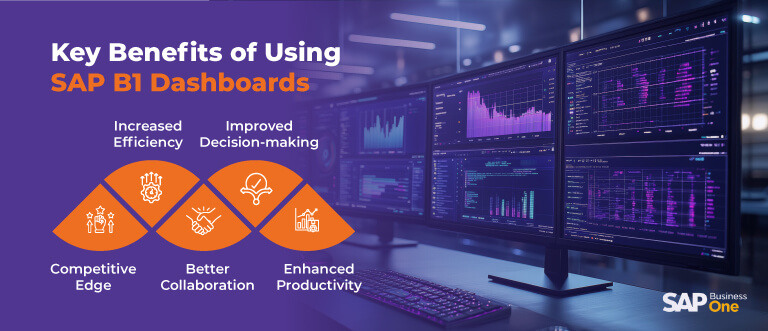
Benefits of Using SAP B1 KPI Dashboard for Your Business
SAP Business One KPI dashboards can give real-time insights for promoting data-driven decisions. Moreover, effective and regular tracking of KPIs helps businesses identify bottlenecks and optimize processes. KPI monitoring improves customer relationships and brings a proactive approach. Finally, businesses can increase their profitability and achieve goals using KPIs.
Conclusion
SMEs need to track some top KPIs in SAP Business One, including CAC and operating cash flow. It offers various benefits, including better decision-making and higher efficiency while avoiding situations like overstocking and shortages. However, it is imperative to get SAP B1 dashboards from a reputable partner to leverage these benefits for your company.
B1 Analytics Dashboards offer real-time visibility for KPIs and other important parameters of your company. As a leading business intelligence and analytics solutions provider, we assist global enterprises in leveraging the advantage of SAP Business One analytics. Contact us to learn more about the role of SAP Business One KPIs in growing your business.